


I. Presentation▲
Most assemblies in the world use a hemicycle design, with representatives seating along a left-right axis, from the chairman’s point of view. Hence, the semicircular chart, or Parliamentary chart, has become the most obvious way of displaying the number of seats per political group in a chamber. On the other hand, this chart seems too specific to be used in any other context, so data viz tools like Excel or Tableau do not include it among their standard chart types.
I-A. Objective▲
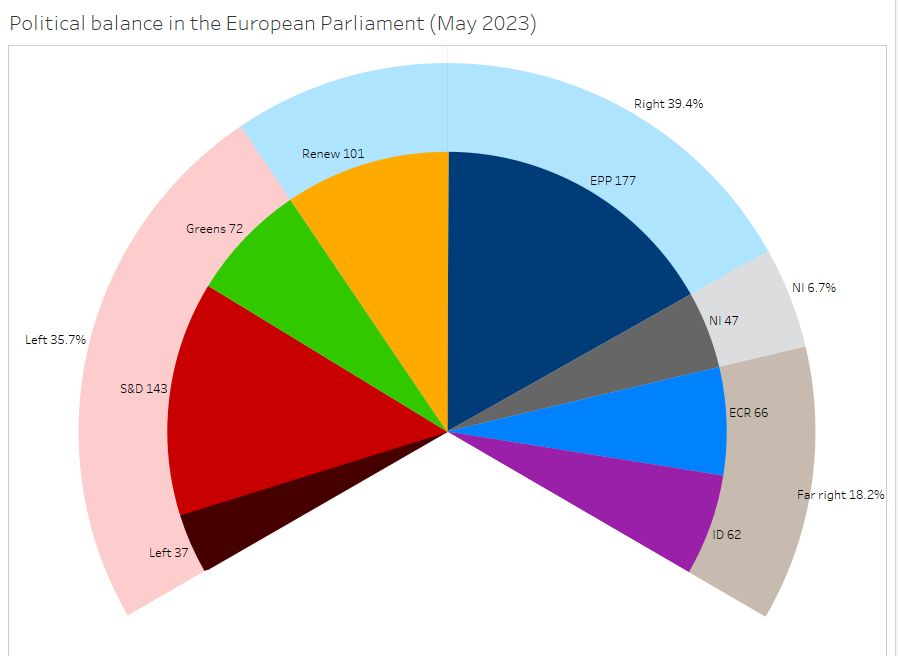
We aim to display on a hemicycle the balance of a political assembly organized along a left-right axis. When looking for an English-speaking case, I ruled out the UK Parliament (it is rectangular) as well as the US Congress (the two-party system makes the viz boringly simple), and decided for the European Union Parliament. Here is the final result:
You can download the datafiledatafile (text separated by tabs) I have used or look for a fresher version. You can also download my complete Tableau workbookTest workbook in .twbx format.
I-B. Tableau vocabulary▲
I will describe the handling of Tableau with its specific vocabulary. For a better understanding, I will now precise these various terms; you can skip this part if you are familiar enough with Tableau.
Tableau files are called workbooks, just like Excel files, for the same reason: they are composed of tabs. The first tab is always the Data Source, the others are worksheets. When you are on a worksheet, the left bar with the list of data fields is the data pane. These fields are displayed in two alphabetical lists, dimensions first and then measures.
The main part of the worksheet is the workspace; above it and left there are shelves: Columns, Rows, Pages, Filters and Marks. This last shelf is a bit more complex, as it includes a series of different tools, that can vary according to the chart type: Color, Size, etc. For a good part, working with Tableau consists in arranging data fields on shelves, where they are displayed as pills.
The right bar (if it shows) can display various cards: legends, shown filters, shown parameters. Above the cards, to the right of the menu bar, there is a button to display the Show Me bar, a sort of favorites bar leading to predefined charts.