III. Pivot data▲
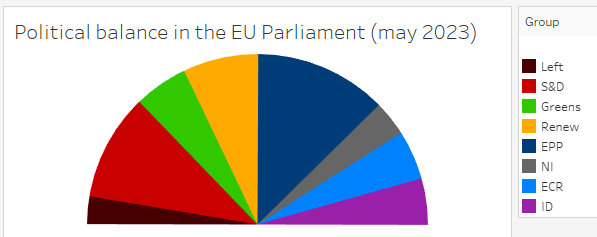
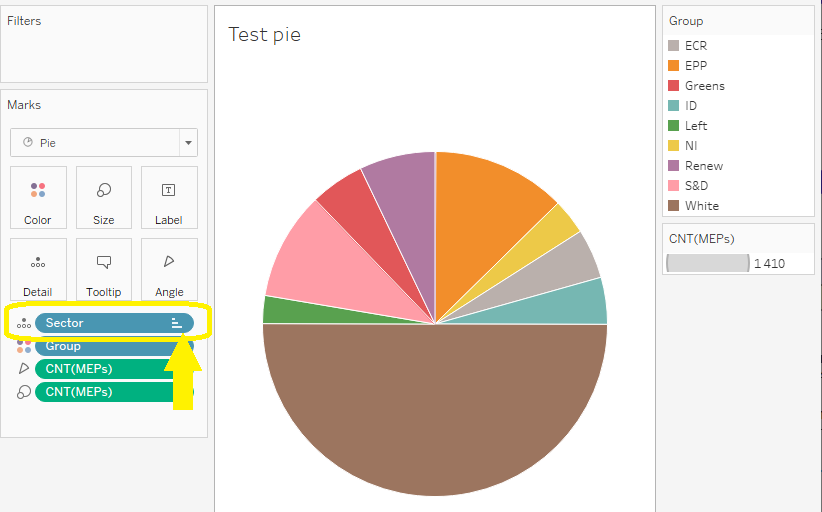
This first viz reveals the main difficulty: for Tableau, the first pie share begins at the top center; in other terms, the pie begins at noon and turns clockwise. By comparison, Excel pies also by default at top center, but they let the user customize the angle of the first sector; if Tableau was that flexible, we could just begin at 270° (at 9 o’clock, for a less geometric term) and the hemicycle would be ready. Alas, Tableau does not include such an option, and its pies always begin at noon.
Terefore, the problem we have is basically a question of sorting order: we want a left-to-right display while Tableau forces us to begin in the very center. We will have to position our MEPs in this order:
- in the first quadrant (from noon to 3 o’clock), the groups at political center right, then right wing and eventually far right
- in quadrants #2 and #3 (from 3 to 9 o’clock), the ‘white’ group
- in the last quadrant (from 9 to midnight), groups from the far left(1) to center-left
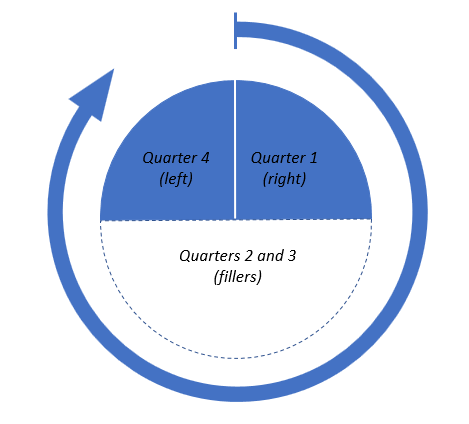
If we were incredibly lucky, the left wing and the right wing would balance exactly and each group would fit in its quadrant. But actually, we have to expect that one group will spill out of the right quadrant over the left one, or vice-versa. So, once the sorting issue is resolved, we will have to split this central group into two parts, the first one at center-right, i.e. at the very beginning of quadrant #1, and the second part at center-left, i.e. at the very end of quadrant #4.
I now suggest you have a break in your reading, in order to think about a strategy to solve both the sorting issue and the splitting of central group; you can then read my proposal.
III-A. Setting up the left-right axis▲
To split the pie into quadrants, the key information is the position of each group along a left-right axis. However, there is no such data in our source file, as it is a question of political interpretation, with a part of subjectivity and a part of dataviz strategy. After consulting the seating plans, I would propose you this order:
- ‘The Left group in the European Parliament – GUE/NGL’ (Left), including most European communist parties
- ‘Group of the Progressive Alliance of Socialists and Democrats in the European Parliament’ (S&D)
- ‘Group of the Greens/European Free Alliance’ (Greens), with ecologists
- ‘Renew Europe Group’ (Renew), including center-right and liberal parties
- ‘Group of the European People's Party (Christian Democrats)’ (EPP), with conservative right parties.
- ‘Non-attached Members’ (NI) … this group gathers marginal parties and MEPs who have not joined any existing group, e.g. Italian populists of M5S, Greek communists, French far-right MEPs opposing other far-right parties, Catalan independentists, and so on. The majority in the EU Parliament usually ranges from S&D to EPP, and excludes of course most of the non-attached, so in dataviz terms we should display them out of the majority: either between left and far-left or between right and far-right; as the biggest chunk of this group (12 out of 47) is the Hungarian Fidesz party, expelled from EPP group, the latter option seems more conform to a sort of political average position; moreover the seating plans locates them between EPP and ECR
- ‘European Conservatives and Reformists Group’ (ECR), with nationalist or far-right parties around the Polish PiS
- ‘Identity and Democracy Group’ (ID), with other far-right parties around the Italian Lega and the French RN. It is difficult to say which of these two groups is right-most, so once again I just followed the seating plans
As most official group names are much too long to display on a chart label, I have included shorter names, inspired from the seating plans. Of course, you can opt for different short names and/or political sorting without affecting the rest of this exercise.
Let us evolve our Group formula to implement these short names:
IF RIGHT([Table Name], 1) = "1" THEN "White"
ELSE
    CASE [Political Group]
        WHEN 'The Left group in the European Parliament - GUE/NGL' THEN 'Left'
        WHEN 'Group of the Progressive Alliance of Socialists and Democrats in the European Parliament' THEN 'S&D'
        WHEN 'Group of the Greens/European Free Alliance' THEN 'Greens'
        WHEN 'Renew Europe Group' THEN 'Renew'
        WHEN 'Group of the European People''s Party (Christian Democrats)' THEN 'EPP'
        WHEN 'Non-attached Members' THEN 'NI'
        WHEN 'European Conservatives and Reformists Group' THEN 'ECR'
        WHEN 'Identity and Democracy Group' THEN 'ID'
    END
END
III-A-1. Exercise: sorting groups left to right*▲
On a simple pie chart, we could have used a Manual Sort, but here we will need to do math for splitting the central group. So, you now have to create the sorting order as a new calculated field, let us call it LR Group Position. Please beware the ‘white group’, which should be excluded from this left-right sorting.
III-A-2. Answer▲
III-B. Splitting the central group▲
Now, we have to distribute the MEPs of the central group to balance exactly the top left quadrant (Q4) with the top right quadrant (Q1). As this means splitting a group, we have to sort the individual MEPs along a left-right axis to find out where is the exact middle. Of course, we will not survey the political positioning of each representative: we just have to balance quadrants in the pie, so we can consider MEPs as completely interchangeable.
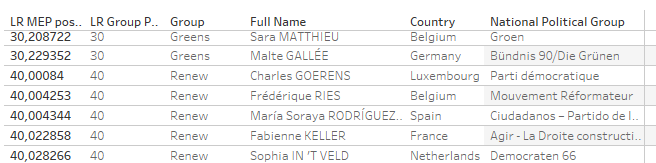
III-B-1. Exercise: sorting MEPs left to right*▲
Create a calculated field, LR MEP position, that should abide by the left-right sorting order of groups and forces an arbitrary left-right order within MEPs of the same group.
III-B-2. Answer▲
III-B-3. Exercise: find the middle*▲
Which calculation function can we use to compute which left-right position matches noon position? In other terms, which is the left-right position that splits MEPs in exact left and right halves?
III-B-4. Answer▲
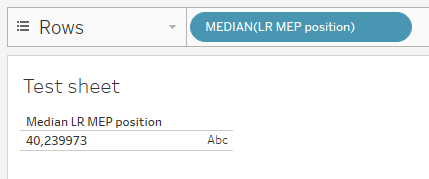
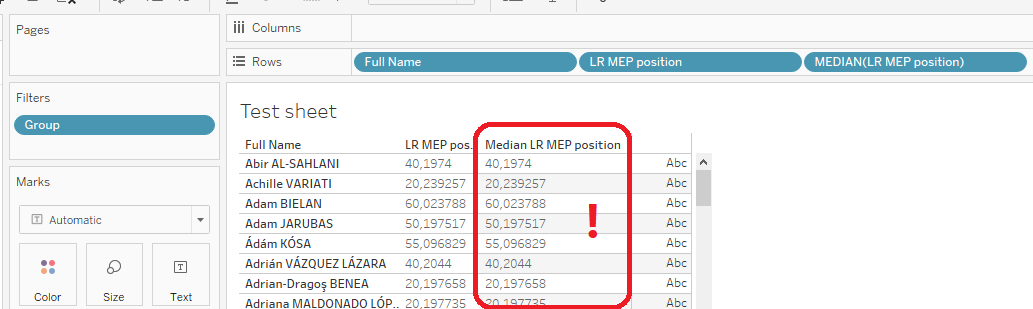
III-B-5. Exercise: compute noon position***▲
This way of calculating the median is perfectly logical, but very annoying for us. We have to compare each MEP to the median, so we know whether the MEP should be on the left quadrant or the right quadrant. Hence, we have to be able to compare the individual position of each MEP to the global median, i.e. computed on the whole population of MEPs.
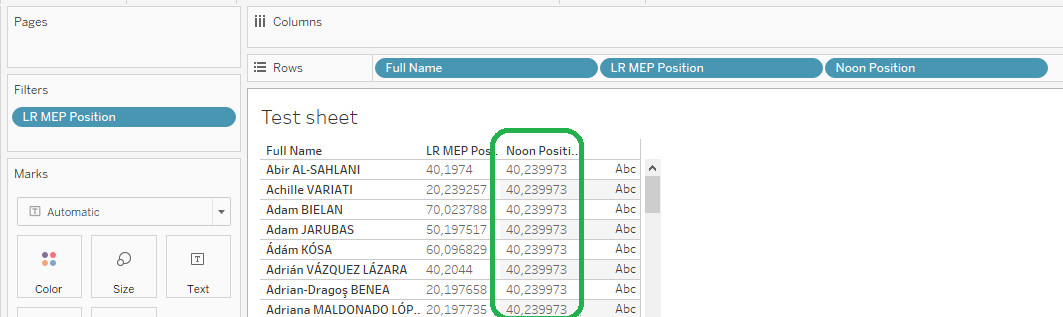
We could of course create a constant or a parameter and value it to 40.239973. That would be good enough for a single-use viz, but this figure would become wrong as soon as the source data is modified or updated. For an elegant and enduring solution, you now have to create a new calculated field, Noon Position, to bring to global median down to detailed level ((MEP).
III-B-6. Answer▲
III-B-7. Exercise: compute quadrants*▲
Now we have the Noon Position, you just have to create a Quadrant calculated field to compute the quadrant of each MEP or filler. Here is the detailed specification, according to the sketch presented above:
- MEPs at the right of Noon Position go to quadrant #1
- fillers go to quadrants #2 and #3 (no need to differenciate between them)
- MEPs at the left of Noon Position go to quadrant #4
III-B-8. Answer▲
III-B-9. Exercise: compute sectors*▲
Each political group will get its pie share, except the central group which will get two, one at center-right and the second at center-left. Just create a Sector calculated field to implement this notion.
III-B-10. Answer▲
III-C. Sorting sectors in clockwise order▲
Let us be back to our first draft pie.
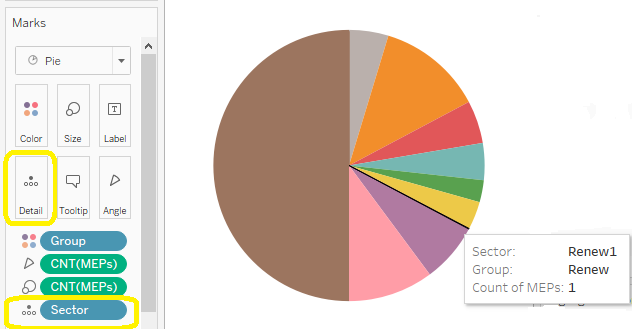
III-C-1. Exercise: change granularity of the chart**▲
The color is determined by the group, which is what we want. Yet, we want two same-colored sectors for the central group, how to do it?
III-C-2. Answer▲
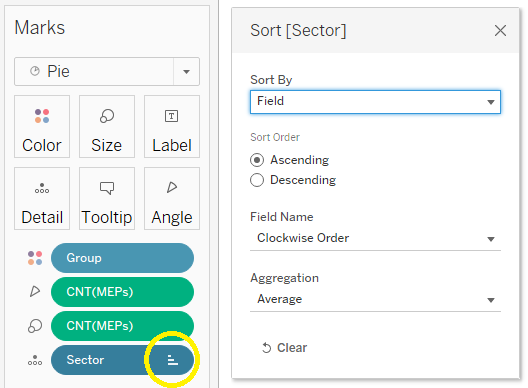
III-C-3. Exercise: sort clockwise**▲
Now you just have to sort the sectors in the right order, i.e. from noon to midnight; according to our four-quadrant sketch, sectors must begin with center-right, go to far right, go on with the fillers, resume with MEPs at far left and finish at center-left. Here the instructions for this exercice:
- create a calculated field, Clockwise Order, to implement this order
- choose the right qualification (dimension or measure) for this calculated field and set the necessary default properties
- use this calculated field so that sectors get ordered as we want
III-C-4. Answer▲
III-D. Finishing touches▲
Our base structure is now sane, but the hemicycle is not yet ready for end users.
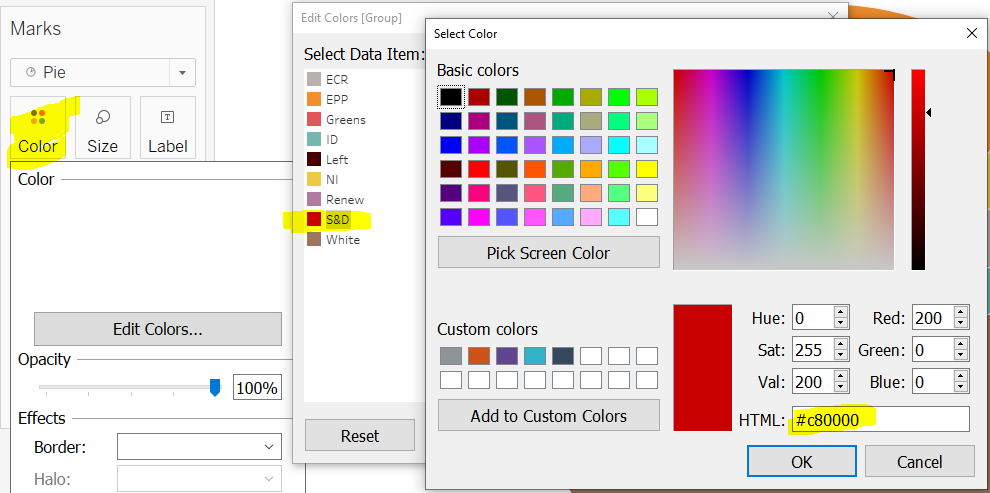
III-D-1. Exercise: choose colors**▲
Colors are always a hazardous matter in dataviz, with developers navigating through business habits, technical requirements, cultural connotations and his/her own subjectivity. Of course, it is even more sensitive with a political topic (OK, that is quite obvious for the Greens, but what about ID?).
You now have to find an indisputable color for each political group.
III-D-2. Answer▲
III-D-3. Exercise: cleaning up*▲
Our pie is starting to look like a hemicyle!
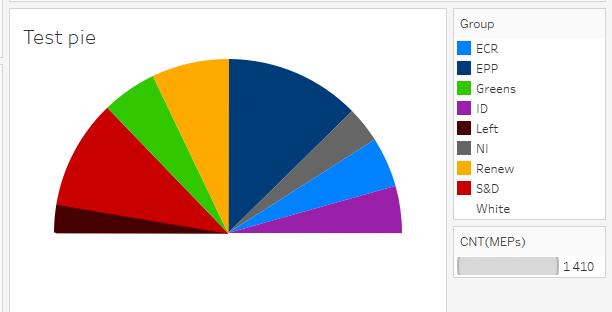
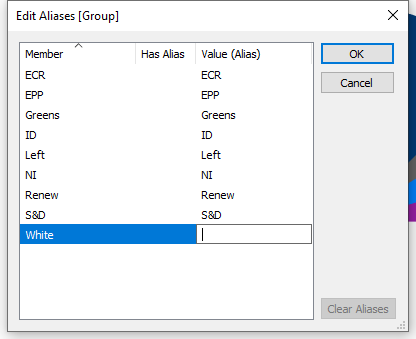
We did add a good half of filler data, but the user should ignore this artifact. Erase the traces!
III-D-4. Answer▲
III-D-5. Finishing the first version▲
Just add a meaningful title, and we have a consistent hemicycle.